
Those things you used to draw on graph paper, only using javascript.
When creating something like this using a visual library like p5.js, I like to break the task down into more achievable goals that I can write the code for and get each one working one after the other.
Having not used this library for a while the goals started off simple and got more technical from there.
- Plot lines on the canvas
- Divide those lines into segments where the connecting lines would start and stop and draw points to show them
- Connect the points with lines
- Refactor the code
- Style it a bit

Some very quick points about p5.js:
– You can easily plot shapes on a canvas using a coordinates system where (0,0) is the top left by default
– I’ve specified noLoop() so the canvas only renders once which is useful for static drawing but not for interactive piece which it could be in a later step
– I’ve specified the parameters for these lines using the following object to begin with, however there is possibly a better way which I’ll implement later
const lines = {
  line1: {
    start: [20, 20],
    end: [150, 210]
  },
  line2: {
    // use line1.end for the start of line2
    start: [],
    end: [330, 130]
  }
};
2. Divide lines into segments

Note that const divisions = 4; is declared at the top and each line has 4 dots along the length as well as an extra one on the end. Also note that the points are drawn on different parts of each of the lines, hence the use of two almost identical functions.
The coordinates for the points are pushed to a nested array by these functions and a nested for loop accesses them in the draw function to plot the points.
I’ve also used p5.js’s push() and pop() functions to enclose the lines of code that draw the points. Anything that’s changed inside them like stroke width or colour, or any coordinate transformations that are applied are ignored after the closing pop() declaration. This feature is especially useful in a visual library.
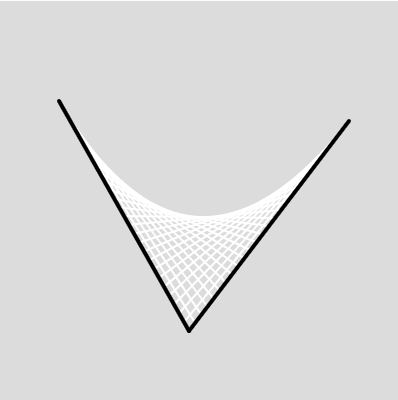
3. Add the lines between the lines


This doesn’t look very impressive at the minute… moving the two main lines around a bit by changing their coordinates as well as increasing the number of divisions to 25 makes it look like it took a lot longer to write the code for. It also shows the benefit of declaring constants instead of hardcoding values into multiple functions.
4. Refactoring the code
There were a lot of optimisations to be made in the code. The bulk of my time here was spent breaking down the monolithic functions that calculate the coordinates used to draw the lines.
This was good practice in writing more compartmentalised and reusable code. Are the refactored functions perfectly reusable? No, but they are closer to being reusable than what came before them.
Have a look at the code for this step and compare it to the previous step to see all the changes. Here I’ll expand one part of the refactoring process: how I decided to specify the coordinates used to draw the two main lines from step 1.
It started out as this:
const lines = {
  line1: {
    start: [60, 100],
    end: [190, 330]
  },
  line2: {
    // use line1.end for line2.start
    start: [],
    end: [350, 120]
  }
};
This is usable but having to comment that line1.end. should be used in place of line2.start is a complete hack and probably not good practice. Also having to specify lines.line1.start[0] every time I need to access a single coordinate value is time consuming and can really crowd up the code.
Therefore I decided to use the following structure instead:
const line1 = {
  x1: 60,
  y1: 100,
  x2: 190,
  y2: 330
};
const line2 = {
  x1: line1.x2,
  y1: line1.y2,
  x2: 350,
  y2: 120
};
- The objects are one layer deep, meaning
line1.x2is all that’s needed to access a coordinate value that previously requiredlines.line1.end[1]. line1.x2is a lot more readable, returning the line1’s end point x coordinate.- The second line’s start coordinates can easily be made equal to the end coordinates of the first line since the two objects are defined separately, something that’s not possible in the original single object.
Another option would be to think of the two lines as one path with multiple points, in this case the coordinates for the lines could be defined in an even simpler way:
const linePoints = [
  [60, 100],
  [190, 330],
  [350, 120]
];
P5.js has this functionality built in as well. I began the sketch simply drawing two separate lines on the canvas and worked from there. Therefore, the code I’ve ended up writing to plot the lines that make up the curve works using an input of two objects each holding the coordinates for one of the lines.
A good next phase would be to rewrite it, replicating the current functionality only but with this new array of path points as an input. Oh and make it all work with more than two main lines to draw curve lines between.
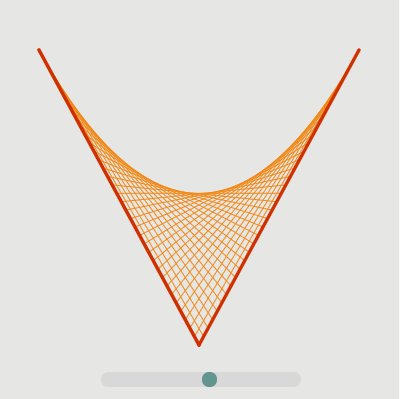
5. Styling
To finish the sketch I added some colour codes for the different parts of the sketch. I was also able to add a bit of interaction by making the point of the two lines follow the cursor and finally, I added a slider to control the number of divisions that make up the curve.
To make the point follow the cursor I simply removed noLoop() from setup and added the following line in the draw function, so they are run every time the sketch is redrawn. Easy.
line1.x2 = mouseX;
line1.y2 = mouseY;
line2.x1 = mouseX;
line2.y1 = mouseY;
Notes
Possible additional features might be:
- Having more than just two lines and adapting the functions to work with however many lines are passed into them.
- A way to make each of the lines that form the curve a different colour, maybe they could form a gradient across the curve. Even using button presses to cycle through a library of colour schemes.
The basic wordpress plan makes it a pain to nicely embed a project like this, that’s why the code for each step is linked via the headings. All the sketches used in this post are visible together in a collection, linked below.
